Article content
Segment review #2, Games 11-20
It’s been six weeks since the NHL season began for the Edmonton Oilers, and already they’ve hit the 20-game mark. It was an underwhelming first quarter for the preseason favourite with a decidedly mediocre 10-8-2 record and a .550 points percentage in what is currently a .551 league. As might be expected, that percentage lands them right in the middle of the pack of the Western Conference, currently in a wild card spot but hardly comfortable.
Advertisement 2
Article content
The Oilers remain underwater by one important measure, goal differential, having allowed 7 goals more than they’ve allowed with 55 for, 62 against. If goals are the primary currency, they’re lucky to be as high in the standings as they are.
Split those 20 games into distinct 10-game segments, though, and a different picture emerges. The Oilers were brutal in the opening set, and stabilized all the way to roughly average or should I say “expected” in the more recent 10. The effect on the season as a whole is a regression towards the mean, even as the local club has yet to to fully erase the effects of that bad start. That either takes time or a hell of a hot streak, as was proven last season:
Season to date by segment
2023-24
Games 1 – 10: 2-7-1, .250 | 27 GF, 41 GA | 334 SF, 302 SA | .945 PDO
Games 11-20: 5-5-0, .500 | 39 GF, 33 GA | 328 SF, 272 SA | .998 PDO
Games 21-30: 7-3-0, .700 | 37 GF, 29 GA | 371 SF, 271 SA | .993 PDO
Games 31-40: 10-0-0, 1.000 | 37 GF, 16 GA | 340 SF, 278 SA | 1.051 PDO
Games 41-50: 7-3-0, .700 | 35 GF, 25 GA | 310 SF, 284 SA | 1.025 PDO
Games 51-60: 7-2-1, .750 | 37 GF, 29 GA | 324 SF, 286 SA | 1.013 PDO
Games 61-70: 5-3-2, .600 | 38 GF, 30 GA | 364 SF, 294 SA | 1.002 PDO
Games 71-80: 6-2-2, .700 | 39 GF, 23 GA | 341 SF, 268 SA | 1.029 PDO
Advertisement 3
Article content
2024-25
Games 1 – 10: 4-5-1, .450 | 22 GF, 35 GA | 343 SF, 261 SA | .930 PDO
Games 11-20: 6-3-1, .650 | 33 GF, 27 GA | 318 SF, 249 SA | .995 PDO
As discussed in our previous 10-game review, the barometer for success or failure in any set of games is the last figure shown. PDO is simply the sum of shooting and save percentages. It was historically terrible in the first 10 games, but normalized to near the midpoint of 1.000 in the second.
As they did consistently all of last season, the current Oilers significantly outshot their opponents in each group of games, which reflects the quality of the team; it follows that by merely breaking even on the percentages they will outscore their opponents. Which they did in the more recent segment by 33 goals to 27 after an excruciating and barely explicable 22-35 deficit in the opening run.
11 more goals scored, 8 fewer allowed. Both numbers needed drastic improvement, and these results represent a very significant step in that direction.
One aspect that has remained nearly constant for the 2024-25 Oilers is that their success or failure has hinged on whether they score 3+ goals. So far this season, they are 10-0-1 when doing so, 0-8-1 when they don’t. But in the second segment they had 7 such games after just 4 in the first 10 games. Ergo, more wins.
Article content
Advertisement 4
Article content
Related: Edmonton’s shooting percentage soared from a dismal 6.4% to a normal-ish 10.4%.
While the Oilers had a very similar share of shots in each 10-game set, one area their performance ticked up was in the more dangerous opportunities, the counts we conduct through video analysis here at the Cult of Hockey. In the first 10 they had 157/289=54% of Grade A shots in all situations and 71/135=53% of the subset of 5-alarm chances, slightly below their overall shot rate though still on the good side of break even. In the second 10, those shares edged up to 140/241=58% and 65/110=59% respectively, somewhat better than their shot rate. The big driver in both categories was much better suppression of opposing chances (give or take the odd howler).
What we haven’t seen yet but which is likely to come, is a segment or two where the percentages run hot; when that happens, and assuming the Oil remain an outshooting team, the wins will come in bunches. The 2023-24 version of the Oil were on the right side of 1.000 the last five segments in a row and posted a 35-10-5 record in that time. By season’s end the 7-12-1 first quarter was a distant, albeit unpleasant, memory.
Advertisement 5
Article content
Despite its modestly better record through 20 GP, there are no guarantees the 2024-25 edition of the squad is as good as last year’s, even as some parallels can already be drawn. But for the impatient among us who are not too impressed with a .550 team — and I can certainly identify — let’s take some solace in this spin on the events of the last six weeks:
- In the first 10 games, the Oilers had 57% of the shots but just 39% of the goals, and 40% of the wins..
- In the next 10 games, the Oilers had 56% of the shots and 55% of the goals, along with 60% of the wins.
One of those data sets seems a lot more repeatable than the other.
Goalies
Strange splits here in the sense that Stu Skinner got the better results in the standings even as nominal backup Calvin Pickard posted significantly better percentages. The big difference was goal support; the Oilers averaged 4 goals per game in front of Skinner, but just 2 for Pickard, and were in fact shut out in both of his losses.
As with the shooters, the stoppers improved their percentages in the second 10, and the team save percentage (which includes empty netters that aren’t charged to the individual tenders) rose sharply from .866 to .892. Still room for improvement, but a lot closer to “normal”.
Advertisement 6
Article content
Defencemen
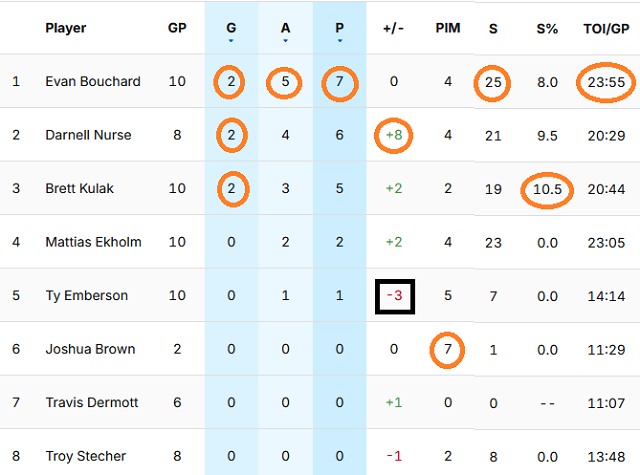
Standout defender in this group of games was the oft-maligned Darnell Nurse who had his best run of play in some time before being shoulder-capped into the middle of next week (possibly literally) by Toronto’s Ryan Reaves. Unfortunate timing, that. In the 7+ games he played, Nurse was on the ice for 9 even-strength goals scored by Edmonton, just 1 against. All 6 of his points came at even strength, including 4v4 and 3v3 scenarios.
As might be expected for a powerplay quarterback, Evan Bouchard emerged as the top scorer for this segment, though it took a 3-point outing in the most recent game to get there. The last of those came on the powerplay, just his third point at the discipline this season. 0.15 PPP/GP, a far cry from last season’s 46% (37 in 81 GP), nevermind the 56% he posted in the playoffs (14 in 25). Is the powerplay slumping because he’s slumping, or is it the other way round? Smart money would have both returning to form sooner than later.
Brett Kulak was a revelation in an elevated role, splitting his time between two very different partners in Nurse and Ty Emberson.
Advertisement 7
Article content
Josh Brown was recalled from Bakersfield to cover off some aspects (size, aggressiveness) of Nurse’s game. In just 2 games he accumulated the most penalty minutes of any Oiler, d-man or forward, in the entire segment. Coincidental penalties in each case, a little pushback from a team that needs some of that, especially in the absence of their resident policeman.
Forwards
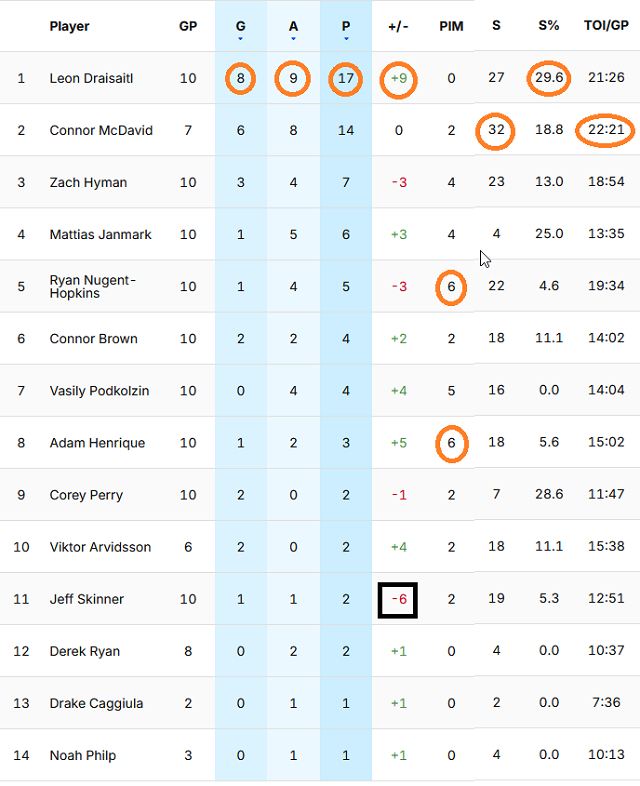
Just a superb set of games from Leon Draisaitl, who managed to lead the team in goals, assists, points and plus. Along the way Drai produced 7 multi-point games, in which the Oilers went 6-0-1. The less said about the other 3 games, the better; let’s just say when Leon wasn’t scoring, the Oilers weren’t scoring.
The guy who frequently tops this table, Connor McDavid, missed the first 3 games after getting banged up early in Game 10, but he returned to high-octane form soon after his return. His segment was highlighted by a rush to 1,000 points, a milestone #97 achieved with gusto during an impressive 2-game homestand in which he chipped in on 6 of 7 Edmonton goals including both overtime winners. His 32 shots were an impressive number considering the missed games.
Advertisement 8
Article content
Not a whole lot of joy further down the line-up, though, where the season-long goal scoring drought remained in the ascendant though not quite so bad as it was. Sad fact is through 20 games none of the supporting cast had as many as 10 points, or as many as 4 goals for that matter. Not a one of them is on pace for more than a dozen goals.
This was the second segment in a row that the Draisaitl-McDavid duo scored more goals than the rest of the supporting cast combined; the good news is that the numbers rose on both sides of that equation, with Connor and Leon jumping from 9 goals in the opening set to 14, and the supporting cast from 6 to 13. Add in 6 from the defence corps and that’s healthy goal production, even as its weirdly distributed.
Zach Hyman did deliver a respectable 3-4-7 after a dismal 0-2-2 in the opening 10, so is trending upward… or was until he got hurt in Game 20. So too is Mattias Janmark, at least on the playmaking front; he had but 4 shots on net and a lone empty net goal.
Meanwhile young Vasily Podkolzin hasn’t found the net at all but is doing a lot of other things from banging the boards and making plays to killing penalties and punching faces. With so many of the more veteran wingers struggling, the coaching staff is giving the younger man every chance to make (and leave) his mark. The 24-year-old Russian is the only winger on the club under 30 years of age, so it would be a major development were he to achieve a breakthrough.
Advertisement 9
Article content
Player grades
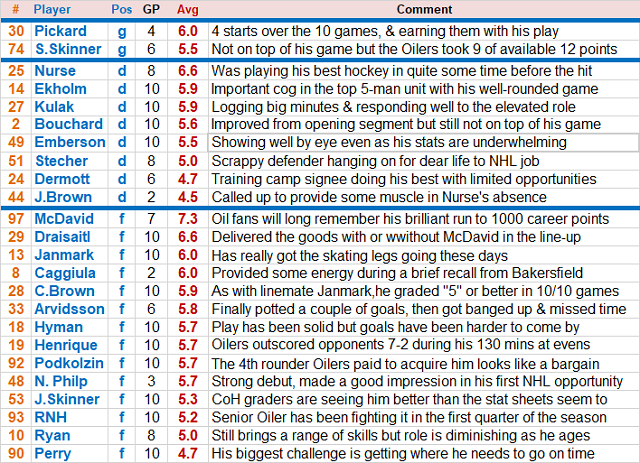
We close in our usual fashion by reviewing the set of 10 games through the lens of our own subjective ratings here at the Cult of Hockey. Regular readers will know that we grade on a scale of 1 to 10, the performance of every Edmonton Oilers player in every game the team plays, based on a combination of observation and interpretation of statistical output. Here are average grades for Games 11-20 along with our customary thumbnail comment summarizing each player’s contribution over that span:
Results by grader, second segment:
- David Staples — 4 games, 1-2-1, average grade 5.5
- Bruce McCurdy — 4 games, 4-0-0, average grade 6.0
- Kurt Leavins – 2 games, 1-1-0, average grade 5.4
- Segment totals – 10 games, 6-3-1, average grade 5.7
Article content


